
Thierry Fournier, artist and curator
Introductory text to the group show Données à voir (Data on view), La Terrasse, espace d’art de Nanterre, France, October 7th – December 23th 2016, Curated by Sandrine Moreau and Thierry Fournier. Text translated by Clémence Homer. Photograph : Martin John Callanan, A Planetary Order, sculpture, 2009.
*
As the concept of data has become ubiquitous and seems inseparable from the contemporary era and from the Internet, a broader look back on recent history reveals works of art that were already challenging that very notion several decades ago. Yet between these artists from the seventies and the contemporary works that address the issue of data, two points in common appear: a critical approach, which highlights systems of relations, of representations, and of power; and the use of drawings and of code (sometimes simultaneously) to visualize these systems, transpose them and question their stakes. This exhibited data raises multiple queries, both individual and collective. What is our place in these systems? How can artists discuss it? What do we expect from data? How does our freedom unfold in this context?
A long history
Our culture is referred to as post-digital, not to suggest that the Internet is behind us, but rather that it is now ubiquitous, pervading contemporary society’s practices and apparatuses. The Internet is no longer separate from the everyday world, nor is it in any way virtual – rather, it is well rooted in reality, through its infrastructures, its energy consumption and its globalized labor force, but also because of the way in which it follows, fuels and records our own activities. Our relationship to the network has, in a certain way, taken on the part that electrification played in the 19th century. Data is the “current” that runs through its veins: simultaneously flow and measure, it qualifies and conditions this relationship’s intensities, as the mark and the mirror of our behaviors.
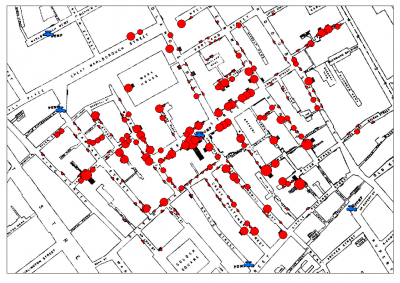
John Snow, clusters of cholera cases in London, 1854
The use of data, however, is grounded in a long-standing history of the measurement of collective phenomena and of exchanges, which began as early as the period of industrialization. As new media theorist Lev Manovitch reminds us, most of the basic data visualization techniques used today were invented at the end of the 18th century – and have actually remained unchanged despite technological revolutions. As an example, after several experiences on collective data, British doctor John Snow invented data visualization back in 1850, when he mapped cases of cholera in London, thereby demonstrating the correlation between the spread of the disease and contaminated water points: one of the first cases of public data mapping was born.
Quantification and surveillance
Therefore, from the very first instances of its use, by revealing a representation that individual perception cannot fully grasp, data is not merely a tool to interpret and transform reality, but it is also an instrument of power. Having become the dominant material of a networked world, its potential for collective action comes with a dynamic of ever-expanding capture: recording and trading personal information; polling and surveying; movement tracking, relationship-, opinion- and preference-mapping, deep-learning and artificial intelligence fed by users, browser histories, recommendation algorithms, enclosure of the web by Google and Facebook, etc.
This generalized quantification, and the surveillance that goes with it, is designed and generated by political and industrial powers. It is fueled by individuals themselves, eager to increase their visibility on the network and exploit it intensely – even if it means quantifying themselves: smart objects, sleep and health trackers, fitness, self-evaluation and the quantified self are replaying expectations of religious redemption. The type of control exerted over individuals that churches and totalitarian societies once dreamed of is now effortlessly obtained, thanks to the miracles of narcissism, the quest for comfort and the fear of missing out. Prophets of the “web’s technological revolution” had not anticipated how the network would channel people’s energies into a hyper centralized system of information, tightly controlled and designed to benefit a small group of businesses and their owners. The stakes involved in decoding, in citizenship appropriation of data, and the “watching the watchers” are becoming increasingly crucial as this situation evolves; they also overlap with the critical approaches frequently taken by artists. For this reason, it was only logical that the exhibition Data on view should present, alongside the works, a series of films and sites that deal with these issues.
The trace and the diagram
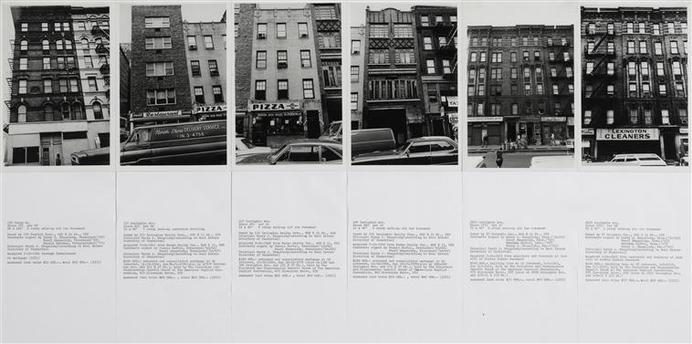
Hans Haacke, Shapolsky et al, Manhattan Real Estate Holding, 1971
The representation of data, of relationships and of power by artists first took off with the protest movements of the sixties, when the emergence of conceptual art coincided with the political engagement of artists. It was in 1971 that Hans Haacke’s solo exhibition at the Solomon R. Guggenheim Museum was canceled, because one of his series of photographs and texts (Shapolsky et al. Manhattan Real Estate Holdings – a Real Time Social System, 1971) listed the names of all of the real-estate owners in Manhattan and revealed that one of the members of the board of the museum, and one of its main patrons, was among the property owners who were accused of being involved in a real-estate corruption scandal. It is this very approach that the drawings of Öyvind Fahlström and Mark Lombardi perpetuate – since well before the advent of the Internet: eminently political world maps, in a process that we will encounter later on in the diagrams created by Ashley Hunt and the collective Bureau d’études.
The concepts of the trace and the diagram are thus central to the Données à voir / Data on view project, as tools for visualization, projection and critique. The term “trace” is taken here in its double meaning, as the footprint that humans leave in data systems, and as the representation that artists make of it. Accordingly, drawing and code (computer programming) play a complementary role: by suspending flows that are usually invisible, they decode them, transpose them, open their black box and question their motives. Not only in the political realm, but also to demonstrate how individuals, with their desires, their imagination and their utopias, are caught up in these force fields.
Broadly speaking, most of the exhibited pieces reveal what Gilles Deleuze and Félix Guattari called “diagrammatic thought”: these works by no means limit themselves to recounting hitherto unformulated structures – rather, they make those very structures come into view. They precede and trigger thought, even before the existence of the drawings. In Foucault, Gilles Deleuze stated that a diagram “never functions to represent a persisting world but produces a new type of reality, a new model of truth. The diagram is not the subject of History, it is above History. It makes History by unmaking previous realities and significations (…). It doubles History with a a sense of continual evolution” (translated by Sean Hand, 2006). As Ashley Hunt himself explains, “I understand these maps as diagrams that might make discourse and action possible” (interview with Natascha Sadr Haghighian, 2008). It is in the creation of this history and of these evolutions that the exhibition is interested: the exhibition Données à voir / Data on view questions data visualization and the modeling of reality that it produces. It asks us what it is that we expect from data visualization and modeling, and how this data constitutes a representation of ourselves, individually and collectively.
The exhibition
When Sandrine Moreau suggested that I join her team to curate this exhibition, she had already laid the groundwork for it, by suggesting the works of Mark Lombardi, Öyvind Fahlström and Ward Shelley. It is this foothold in drawing and in a history that predates the Internet, as well as the two first artists’ strong political commitment, that gave rise to this project’s specific approach towards the relationship that artists have to data – in a way that is quite different from recent exhibitions devoted to these questions in Europe, such as Big Bang Data or Data Deluge. Here, a singular dialogue between drawing and code goes hand in hand with a political inquiry rooted in a historical perspective. This approach informed the choice of works and publications, as well as the selection of films and web sites presented in the documentation area, designed by Agora (Maison des initiatives citoyennes de Nanterre) and artist Benoît Ferchaud, who created an editorial interface.
Données à voir / Data on view brings these works together in one extensive landscape that implies a dialogue and a flow between the drawings – hung around the room – and the installations, publications, films and sites, placed in the centre of the space, on very low standing display units, thereby inviting visitors to pause and have a seat in order to experience the longer time-frames of the videos, networked pieces and web sites.
Two installations (Cracking Data Machine by Ali Tnani and Lukas Truniger, and A Planetary Order by Martin John Callanan), three screen-based works (Data Trails by Ali Tnani, Tracking Transience by Hasan Elahi, and Atlas du Temps Présent by Claire Malrieux), and a series of publications are set up in the exhibition space. The same unit, featuring a low stand, a screen and low seating close to the ground, was designed for the publications. This set-up encourages visitors to connect with the works, and promotes movement between each of these forms, precisely to experience the continuity that links the drawings, the code, the installations and the films, to the same issues.
Four thematic threads are interwoven in the exhibition: two run through just the drawings that are displayed at the edges of the room, and two others pervade the drawings, the installations and one performance.
Networks and power
One dimension that the drawings first put forward is the critical representation of patterns of power relations. Through his “heuristic drawings”, Mark Lombardi reveals the financial networks of a lawyer and those of the president of an American bank convicted of embezzling public funds (George Franconero, Bank of Bloomfield, State Bank of Chatham), as well as the connections between a state bank (Indian Springs State Bank), the mafia and Irangate funding – an operation directed by the Reagan administration, which involved the sale of weapons to Iran to fund the Contra counter revolution forces in Nicaragua. Öyvind Fahlström’s World Map and Column series of drawings, described by the artist as “world maps”, seeks to highlight the power relations that govern the world, and in particular the different components of American imperialism. In his drawing À la Recherche du miracle économique, Julien Prévieux takes excerpts from Karl Marx’s Capital and quotes from British economists, to which he applies the Bible Code, a secular encryption system said to reveal the hidden meaning behind texts – but in this case, the key words portend only catastrophes, crises and scandals. Finally, by showing all of the protagonists involved in the prison industrial complex, Ashley Hunt’s Prison Map drawings shows how the penitentiary system’s desire for growth sustains itself.
Collective processes
Another series of drawings represents collective processes – including those that operate in the art center itself – as does the work of Philippe Mairesse, who, basing himself on interviews and documents, recounts in one of his posters how the activities of the visual arts sector evolved in the city of Nanterre between 2013 and 2014. As for Marie-Pierre Duquoc, she explores the different types of dialogues and appearances of art that occur in various contexts and locations. Each project is part of an experience that she exposes through performed narratives and exhibitions of her drawings, diagrams or flow charts. American artist Ward Shelley deals in his own terms with History, and attempts to understand the world, by organizing a mass of interdependent facts on very large posters, in order to evidence the relationships that bind these pieces of information: the big, colorful diagrams Addendum to Alfred Barr, History of Science-Fiction and Leading Men respectively describe the history of art, the history of science-fiction and the hierarchy of male roles in cinema.
Capture and proliferation
Three of the pieces featured in the exhibition deal with the process of the proliferation of web-specific data, by questioning the power stakes behind it. Such is the case of Martin John Callanan, who challenges types of data visualization and asks what place the individual could carve out for himself in these representations. In Text Trends, pairs of words are compared in Google with the sole purpose of highlighting the user expectations that dictate the fluctuation of their value. The sculpture A Planetary Order shows a still image of clouds above the Earth at a given moment, a mass of data that reduces the planet to its own representation. Tracked by the CIA after September 11th, American artist Hasan Elahi created Tracking Transience, a site on which he posts on a daily basis photographs of every single one of his activities (dining on pizza, visiting restrooms, transiting through airports, waiting at bus stops…) in what amounts to a case study of obfuscation: overwhelming surveillance by saturating it with data.
Drawings and utopias
Through operations that involve the visualization and the transformation of elements extracted or collected from the Internet, other artists address the issue of utopias and of our expectations with regards to data. Since 2014, Claire Malrieux has been working on the series Atlas du Temps Présent (Atlas of the Present Time), by producing a daily drawing from code and scientific data, challenging a possible representation of the present moment. The series is presented here in the form of a video, created by the artist, that shows all the drawings created in the past year. Finding their inspiration in mathematician Grégori Grabovoï’s algorithms, the generative drawings Economie Vibratoire imagine a performative illustration that could utopically influence reality. Ali Tnani extracts data from the network to create, through installations or drawings, “counter-spaces”, which are both visual and political: the installation Data Trails question the transformation that a news story from Tunisia undergoes before becoming a political myth; the installation Cracking Data Machine created with Lukas Truniger transforms data from the network into sound vibrations; through the disappearance of the drawing, the series Blancs Documentaires (Documentary Whites) suggests the fragility of collective movements.
In parallel to the exhibition, by performing a fake Ted-like conference that deals with the compulsive quantification of happiness, French artist Magali Desbazeille brings together a plethora of statistics that measure feelings of well-being, in order to ironically question their meaning and their function.
Finally, and as for myself, having also been invited by Sandrine Moreau to show a piece, but wanting to make space for the artists that we were exhibiting, I chose to use the space of the center’s bay window, which opens out onto the Place Nelson Mandela, with the in situ installation La Promesse that refers to the utopian expectations of control through data about oneself, and about the world.
Artists’ books and films
Several artists’ books are presented in the exhibition – either in order to mention series that would otherwise have been difficult to exhibit in this particular context, or because the artists themselves chose to work with that particular format. In his book Where the F*** was I?, James Bridle published a dizzying series of aerial photographs resulting from (often incorrect) geo-locations produced by his smartphone; Bureau d’études’ (Léonore Bonaccini and Xavier Fourt) An Atlas of Agendas gathers maps of networks of power built at an international level to ensure control over the definition of the planet’s future; Martin John Callanan’s essay Data Soliloquies highlights the ambivalent and dramatized character of data representations; originally created by Eli Commins on the application Whatsapp and exhibited here on a tablet, the Seelonce Feenee project develops a narrative from the traces generated by stakeholders of the aviation community; a publication dedicated to On Kawara’s famous Date Paintings underscores the gesture repeating the same data every day – the date; in the artist’s book My Google Search History, Albertine Meunier ironically reveals the unintentional and frightening portrait that the history of her searches draws of her; The Outage by Erica Scourti is a ghostwritten memoir based on her digital footprint. Finally, and in a nod to History, he exhibition features Jacopo da Pontormo’s Journal: every day, in 1556, the portraitist recorded his meals, which he believed influenced his painting, thereby offering an extremely early form of the quantified self.
The concept behind the exhibition is completed by a series of films, in which documentaries address the violence of the political stakes brought up by activists, or reflected in socio-political situations: Mark Boulos (All that is Solid Melts into Air), Brian Knappenberger (We are Legion: The Story of the Hacktivists), Laura Poitras (Citizen Four dedicated to Edward Snowden), Sandy Smolan (The Human Face of Big Data) et the portrait of Mark Lombardi by Marieke Wegener (Kunst und Konspiration).
Freedoms of perspective
Through the historical relationships that it explores, and through the permanent connection that it highlights between very different mediums, the exhibition seeks to address our relationship to data by means of a transversal approach, in the hopes of demonstrating that it is not in any way limited to a “digital” field, but rather, that it concerns the whole of art and society. The works, on the other hand, do not demonstrate anything: each one finds its freedom in a proposition that can be poetic or critical. They also invite a freedom of perspective and of interpretation.
Special thanks to the artists for their trust, their presence and their seamless collaboration; to Sandrine Moreau and her entire team for her invitation, her generosity and her complete confidence in the elaboration of this project, which managed to open between us – despite the rather short time frame we had – a true meeting space, where we were able to debate and research.
Paris, September 4th 2016